


European stock indices rarely move without a reason. What appears as simple daily fluctuation is usually the result of multiple forces interacting at the same time, from economic data to global sentiment shifts. To understand the broader context of how European markets are performing today, it helps to first look at the underlying mechanisms that drive these movements and shape investor behavior across the region.
This is not about tracking numbers. It is about understanding the cause behind those numbers, which is where real market insight begins.
European Markets Do Not Move Randomly
Market movement often feels unpredictable on the surface, but in reality, it follows a chain reaction of information, expectations, and positioning.
Prices adjust because new data enters the system. That data may come from economic reports, policy signals, or even changes in global sentiment. Once released, institutional investors react first, reallocating capital based on risk and opportunity. This creates the initial movement that retail traders usually follow.
Another layer comes from expectations. Markets do not wait for confirmation. They move ahead of events, pricing in what investors believe will happen next. This is why indices sometimes rise even during negative news or fall despite positive data.
There is also the influence of narrative. On any given day, one dominant theme controls sentiment, whether it is inflation concerns, interest rate expectations, or global instability. That theme becomes the lens through which all data is interpreted.
Understanding this removes the illusion of randomness. European markets are not guessing. They are constantly recalibrating based on information, probability, and collective behavior.
Economic Data That Triggers Instant Market Reactions
Certain moments in the market carry more weight than others. Economic data releases are one of them. When key figures are published, markets do not “slowly react.” They adjust almost instantly.
Inflation data is a clear example. If inflation comes in higher than expected, markets often pull back. Not because inflation itself is surprising, but because it changes expectations around interest rates. That shift is what actually moves prices.
The same applies to employment and manufacturing data. Strong numbers can signal economic resilience, but they can also increase the likelihood of tighter monetary policy. Weak data, on the other hand, may support markets if investors believe it will lead to rate cuts.
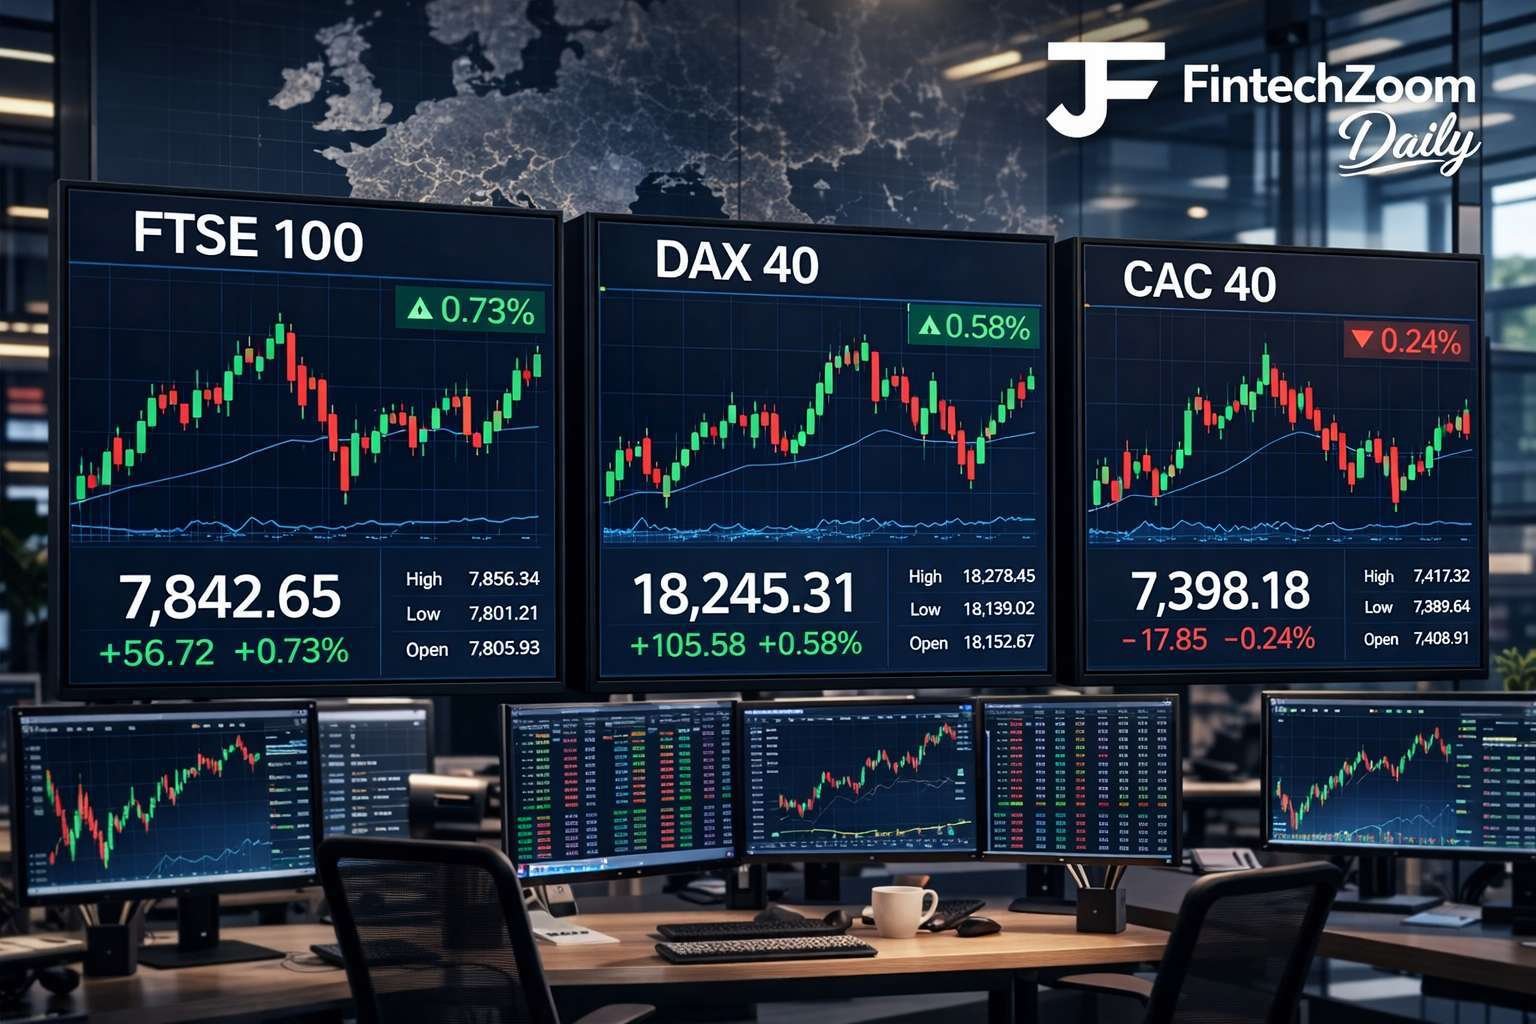
What matters most is not the number alone. It is the gap between expectation and reality, which is often reflected in the movement of major indices like the FTSE 100, DAX 40 and CAC 40. Markets are forward-looking, so any deviation from forecasts creates movement.
Timing also plays a role. When data is released during market hours, volatility tends to spike immediately. In contrast, pre-market releases shape the opening direction, setting the tone before trading even begins.
For anyone trying to understand daily index movement, watching economic calendars is not optional. It is one of the fastest ways to identify why the market is reacting in real time.
How Central Bank Signals Shift Market Direction
Not every market move is tied to hard data. Sometimes, a single sentence from a central bank official is enough to change direction.
The European Central Bank sits at the center of this influence. Its role goes beyond setting interest rates. It shapes expectations about liquidity, borrowing costs, and future economic conditions.
What makes this powerful is the way markets interpret signals. A policy decision itself is often already priced in. The real movement begins when the tone changes. If policymakers sound cautious, markets may assume tighter conditions ahead. If the tone softens, it can trigger optimism even before any actual rate change happens.
Bond yields quietly reflect these shifts. When expectations of higher rates increase, yields tend to rise, putting pressure on equities. When expectations ease, yields fall, often supporting stock prices. This relationship operates in the background but has a direct impact on index movement, especially in the DAX 40.
There is also a timing factor. Scheduled meetings and press conferences create anticipation. Markets position themselves before the event, react during it, and then adjust again after deeper analysis. This layered reaction explains why volatility often comes in waves rather than a single move.
Understanding central bank communication is less about decoding complex language and more about recognizing shifts in direction. Even subtle changes can carry significant weight.
Why Global Markets Influence European Indices
European markets open into a world that is already in motion. By the time trading begins, both Asian and often late US market activity have already set a tone.
The influence from the United States is particularly strong. When major US indices close with momentum, that sentiment often carries over into Europe. It is not just correlation. It is shared capital, shared risk, and overlapping investor behavior.
At the same time, earlier signals often come from Asia. Overnight developments, whether positive or negative, shape expectations before European markets even open. This creates a pre-loaded bias in early trading hours.
Currencies add another layer. A stronger euro can pressure export-heavy companies, while a weaker one may support them. These shifts influence how investors position themselves across indices without directly changing stock fundamentals.
Capital flow ties everything together. Large institutions allocate funds globally, not regionally. When risk appetite changes, money moves across markets quickly, linking performance between regions.
European indices, therefore, are not isolated systems. They respond to a continuous global feedback loop where sentiment, capital, and expectations move across borders in real time.

Where Money Flows Inside the Market (Sector Rotation)
Money does not sit still inside the market. It moves.
Not randomly, not slowly. It rotates.
One day, capital leans toward energy. Another day, it shifts into banks. Then suddenly, defensive stocks start attracting attention. This movement is not noise. It is positioning.
Here is what is actually happening behind the scenes.
When uncertainty increases, investors look for stability, which is why the FTSE 100 often holds up better during uncertain conditions. That is when sectors like utilities, healthcare, or energy begin to hold weight. Not because they promise growth, but because they offer protection.
Now flip the scenario.
When confidence returns, money does not stay in those safe areas. It flows outward into sectors that benefit from expansion. Banking, industrials, consumer-facing companies. These are not just sectors. They are signals of risk appetite.
There is also timing involved.
Large institutions do not enter everything at once. They rotate gradually. First into stronger sectors, then into lagging ones. This creates waves inside the market, even when the index itself looks flat.
And here is where most people get it wrong.
They focus on the index level. Up or down. Green or red.
But the real story is inside the index.
If energy is rising while tech is falling, that is not stability. That is rotation, something often visible in the CAC 40. And rotation often comes before a broader shift in market direction.
So instead of asking, “Is the market moving?”
A better question is: “Where is the money going right now?”
That is where the real signal lives.
What Moves European Markets the Most?
European stock markets are primarily driven by interest rate expectations, economic data releases, and global market sentiment. Central bank signals, especially from the European Central Bank, shape direction, while inflation, energy prices, and movements in US and Asian markets influence daily volatility and investor positioning.
How to Read Daily Market Movement Without Guessing
Most people look at the market after it moves.
Smart investors read it while it is forming.
Start with one question. What changed today?
Not everything matters. Focus on triggers. A data release. A central bank comment. A sharp move in another major market. There is always a starting point.
Next, connect it.
If bond yields rise and equities fall, that is not coincidence. If energy stocks climb while the broader index struggles, that is not random either. These relationships tell a story, but only if you look at them together.
Avoid reacting to headlines alone.
Headlines simplify. Markets do not.
Instead, pay attention to consistency. If the same sector keeps gaining strength over several sessions, there is likely institutional interest behind it. If volatility increases without clear direction, uncertainty is taking control.
Also, timing matters more than people think.
Early moves often come from overnight sentiment. Mid-session moves are usually reaction-based. Late-session activity can reveal positioning for the next day. Each phase gives a different clue.
Reading the market is not about predicting every move.
It is about understanding why a move is happening and deciding whether it is sustainable.
How This Connects to Broader European Market Trends
Daily movement only makes sense when placed inside a wider frame.
A single session might look random. A week might look mixed. But stretch the view further, and patterns begin to appear. Trends form. Momentum builds. Weakness repeats.
That is where a broader perspective becomes useful.
If you want to see how these short-term drivers translate into actual index performance and overall direction, it helps to look at a more complete breakdown of how European markets today are behaving across regions and sectors. This gives context to the daily shifts explained here and connects them to the bigger market picture.
In simple terms, this article explains the mechanics. The broader view shows the outcome.
Both are necessary to understand what is really happening.
Conclusion
European stock markets move through a constant flow of information, expectations, and capital shifts. What appears as daily fluctuation is usually a response to specific triggers such as economic data, central bank signals, or global sentiment changes. Once you start focusing on these drivers, the market stops feeling random.
Instead of reacting to price alone, the real advantage comes from understanding why movement is happening and whether it can continue. That shift in perspective helps filter out noise and makes daily market behavior far easier to interpret.
FAQs
What causes European stock markets to move daily?
Daily movement is driven by new information entering the market. This includes economic data releases, central bank signals, and global market trends. Prices adjust quickly as investors react to changes in expectations rather than waiting for confirmed outcomes.
Do interest rates affect markets immediately?
Yes, but not always directly. Markets often react to expectations of rate changes before decisions are announced. Even small signals from central banks can shift sentiment, leading to immediate movement in equities and bond yields.
Why do European markets follow US markets?
Because capital and sentiment are connected globally. When US markets move strongly, it influences investor behavior in Europe. Many institutions operate across both regions, which creates a natural spillover effect.
What is the biggest driver of stock indices?
There is no single factor, but interest rate expectations tend to have the strongest influence. They affect borrowing costs, valuations, and investor risk appetite, making them a central force behind market direction.
How do investors predict market direction?
They do not rely on one signal. Instead, they combine economic data, policy expectations, sector performance, and global trends to form a broader view. The goal is not perfect prediction, but informed decision-making based on available information.

David Harvey is a Financial Markets Analyst specializing in global markets, investing trends, fintech innovation, cryptocurrency and economic developments. He focuses on delivering data-driven financial analysis and simplified market insights for modern readers and investors.